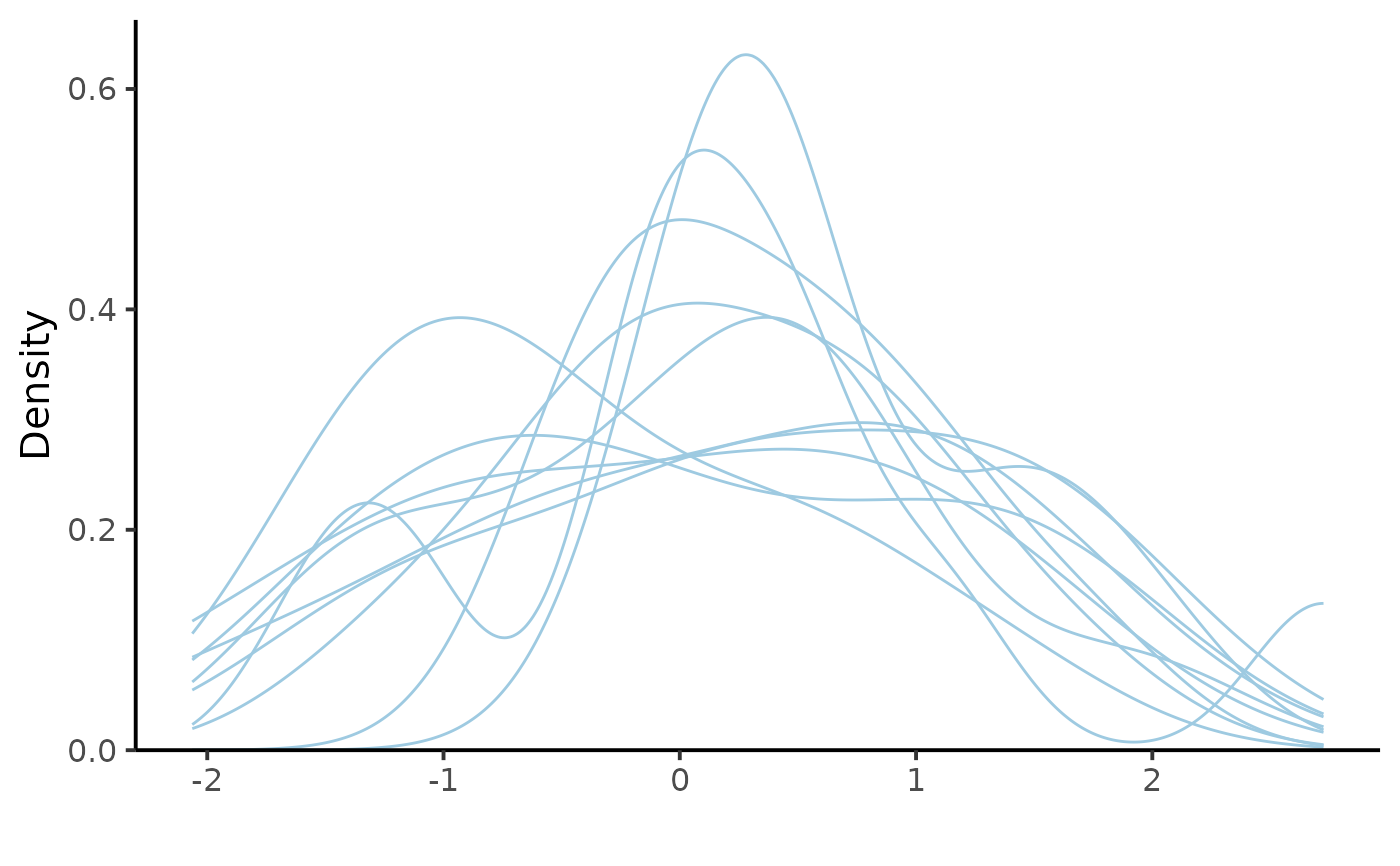
Plot the distribution density of parameters within a same group from a single/multiple draw of the posterior distribution. In the case of a hierarchical model, we might look at the distribution of patient parameter and compare it to the prior for the population distribution.
References
A. Gelman, J. B. B. Carlin, H. S. S. Stern, and D. B. B. Rubin, Bayesian Data Analysis (Chapter 6), Third Edition, 2014.
Examples
X <- matrix(rnorm(1e3), ncol = 10)
PPC_group_distribution(X, "", 10)
#> Warning: `aes_string()` was deprecated in ggplot2 3.0.0.
#> ℹ Please use tidy evaluation idioms with `aes()`.
#> ℹ See also `vignette("ggplot2-in-packages")` for more information.
#> ℹ The deprecated feature was likely used in the HuraultMisc package.
#>   Please report the issue at <https://github.com/ghurault/HuraultMisc/issues>.